There is a great book by the french OULIPO writer Raymond Queneau titled "Exercises in Style": http://en.wikipedia.org/wiki/Oulipo The book is a collection of 99 retellings of the same story each in a different way. It begins simple and ends in a very complex way - what does not change is the story itself as the focus of the work is that "constraints are used as a means of triggering ideas and inspiration".
So this is one key component of this course - we want to advance skills in visualizing data and develop new methods of visualizing but with the constraint of what data to use - that is why every project is focused on the Seattle Public LIbrary. This functions as a control device - each student digs into the same dataset to surface with something different, and each assignment allows for comparing approaches and results.
For March 8, Thursday you will present your work-in-progress:
. We need to see progress
. We need to hear from what you have tried out, and see multiple sketches
. We are looking for good visualization ideas and conceptualization
. The project requires work with the SPL data - dig for data that can provide a breadth of material - so explore general topics which can then be turned into interesting visuals - Javier's and Josh's example of the 3D cubes of vegetables works this way
. Have an evolved conceptual focus. Try things out, see what ends up being an interesting concept
. Provide multiple sketches so we can discuss what may be the best way to go
3.08 3D Final Project Concept & Doodle
3.08 3D Final Project Concept & Doodle
George Legrady
legrady@mat.ucsb.edu
legrady@mat.ucsb.edu
-
hanyoonjung
- Posts: 9
- Joined: Tue Jan 17, 2012 4:40 pm
Re: 3.08 3D Final Project Concept & Doodle
MAT 259 Data Visualization
Final Project - Concept & Doodle
Yoon Chung Han
Idea 1.
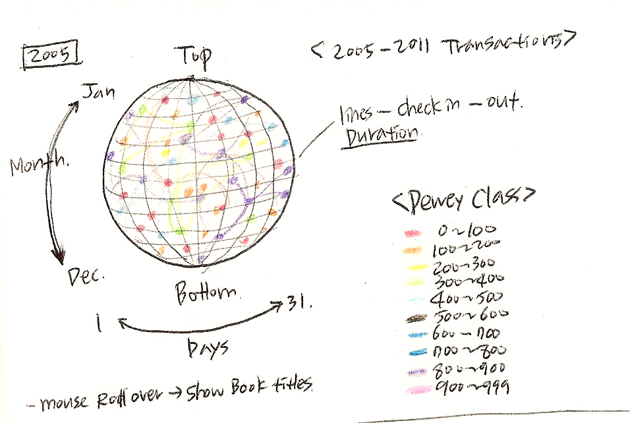
The goal of this idea is to investigate transactions related to "Earth" from 2005 to 2011 by arranging in 3D sphere. In a 3D sphere, there will many small spheres floating inside the sphere, and each small spheres represent each different checked-out and checked-in items. Different colors will represent dewey classes that can make distinct difference among spheres and pleasant visuals. Small spheres will be connected by organic/straights lines each other based on duration of checked it and out time. Overall, the timeline will be arranged in yearly, monthly and daily. The vertical axis will be month section. The horizontal axis will be day section. If users hover the small spheres, detailed information (titles, dates, and duration) will be shown up.
Sketch
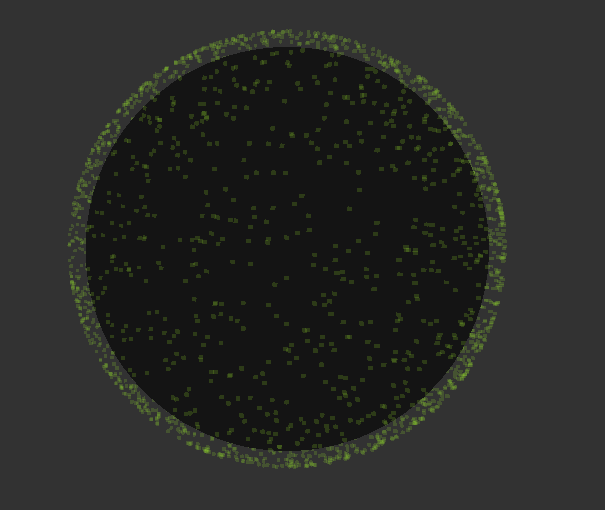
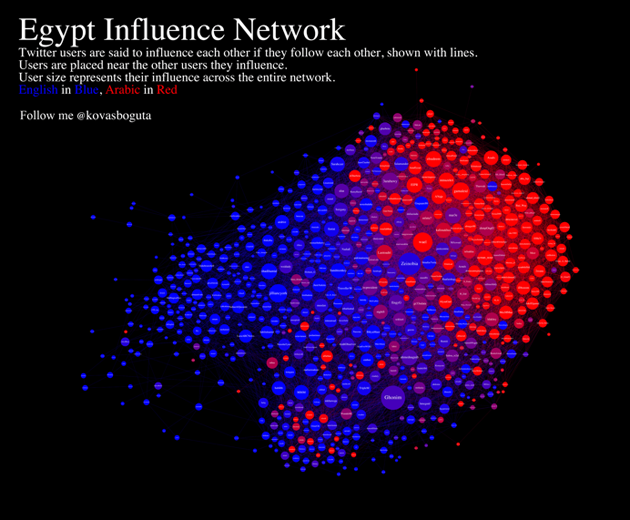
Reference images
Idea 2.
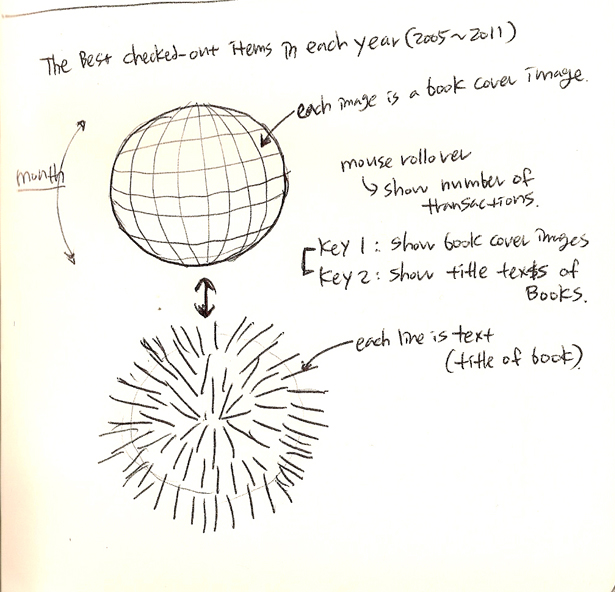
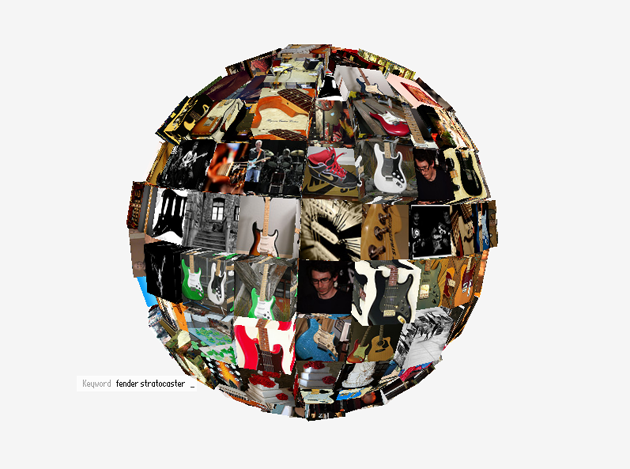
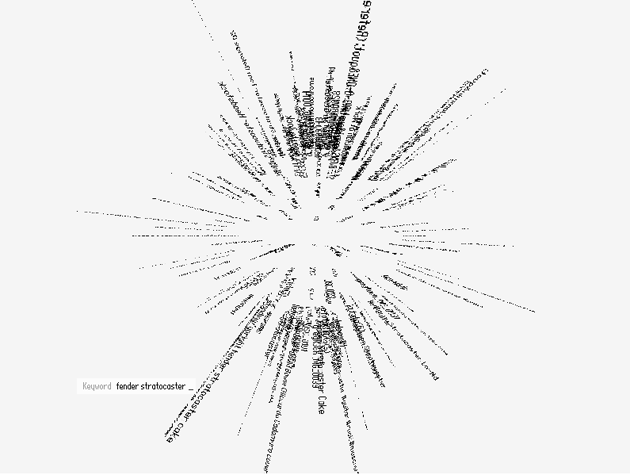
The goal of this idea is to explore the cover images of the most popularly checked-out items from 2005 to 2011. The cover images will be arranged in 3D sphere, so users can explore each different images yearly. If users hover each image, they can get more details such as the number of checked-out, name of authors, titles of books, and dewey classes. The screen will be separated into two sections: the first one will be to show book cover images in 3D sphere, and the second one will be text types.
Sketch
Reference images
Final Project - Concept & Doodle
Yoon Chung Han
Idea 1.
The goal of this idea is to investigate transactions related to "Earth" from 2005 to 2011 by arranging in 3D sphere. In a 3D sphere, there will many small spheres floating inside the sphere, and each small spheres represent each different checked-out and checked-in items. Different colors will represent dewey classes that can make distinct difference among spheres and pleasant visuals. Small spheres will be connected by organic/straights lines each other based on duration of checked it and out time. Overall, the timeline will be arranged in yearly, monthly and daily. The vertical axis will be month section. The horizontal axis will be day section. If users hover the small spheres, detailed information (titles, dates, and duration) will be shown up.
Sketch
Reference images
Idea 2.
The goal of this idea is to explore the cover images of the most popularly checked-out items from 2005 to 2011. The cover images will be arranged in 3D sphere, so users can explore each different images yearly. If users hover each image, they can get more details such as the number of checked-out, name of authors, titles of books, and dewey classes. The screen will be separated into two sections: the first one will be to show book cover images in 3D sphere, and the second one will be text types.
Sketch
Reference images
Re: 3.08 3D Final Project Concept & Doodle
RJ Duran
MAT259 Winter 2012
Data Visualization
Final Project - Concept & Doodle
The goal of this project is to visually explore and navigate the connections between words associated with the word “WATER” in book titles from the Seattle Public Library database from 2006 to 2011. By utilizing a partial FP-Tree algorithm to parse incoming book titles I am able to represent visual patterns in associated words. The idea is that data is represented as tree structures and volumetric pyramids in a polar plane within a navigable 3D space.
This is a concept sketch and additional processing sketches of the idea.
Re: 3.08 3D Final Project Concept & Doodle
Project 3 - 3D Visualization of Treemap
The idea of this project is to extend the capabilities of a 2d treemap into the 3d space. The motivation for this comes from a conference paper - Exploration of the 3D Treemap Design Space - presented in "Poster Compendium of IEEE InfoVis'07". The link to this paper has been added below. Treemaps have been been one of the most accepted hierarchical area based visualization. Each rectangle area represents a information attribute. By giving it a height, i.e. a volume, we can extend the amount of information that we can add to it in the 2d space, where volume can represent a third attribute with the color representing a second attribute. We can still maintain hierarchical relationships as represented in the doodle below.
Conference paper - http://www.informatik.uni-rostock.de/~h ... treema.pdf
The idea of this project is to extend the capabilities of a 2d treemap into the 3d space. The motivation for this comes from a conference paper - Exploration of the 3D Treemap Design Space - presented in "Poster Compendium of IEEE InfoVis'07". The link to this paper has been added below. Treemaps have been been one of the most accepted hierarchical area based visualization. Each rectangle area represents a information attribute. By giving it a height, i.e. a volume, we can extend the amount of information that we can add to it in the 2d space, where volume can represent a third attribute with the color representing a second attribute. We can still maintain hierarchical relationships as represented in the doodle below.
- Doodle
-
anisbharon
- Posts: 10
- Joined: Tue Jan 17, 2012 4:41 pm
Re: 3.08 3D Final Project Concept & Doodle
Anis Haron
Sketches
For my 3d project, i wanted users to be able to navigate through each business day and view number of checkouts in a selected day, compare the data with previous years and at the same time be able to see the bigger picture. I'm interested in using radar map in 3 dimensions as it allows a clear mapping and comparison of data.
Sketches
-
dallasmercer
- Posts: 7
- Joined: Tue Jan 17, 2012 4:43 pm
Re: 3.08 3D Final Project Concept & Doodle
My final project will be a continuation of my Spatial Map project based on Pregnancy. I want to add a 2nd data set based on Birth and see if I can find a correlation between the two. I'd like to turn the 2D squares into 3D boxes and have them all grouped next to each other inside the 3D field.
My inspirations for the visual aspect of this project are a little bit strange (in my opinion) but work really well together to visualize my project. I like the way crystals form their shards and stick out in a linear, jagged, fashion. This is how I see my 3D boxes and the size/length of each box (crystal shard) will be determined by the amount of data it contains. I also see this group of 3D boxes joined together the same way French fries are held together in a box. I want to visualize that same look but without the box of course.
My inspirations for the visual aspect of this project are a little bit strange (in my opinion) but work really well together to visualize my project. I like the way crystals form their shards and stick out in a linear, jagged, fashion. This is how I see my 3D boxes and the size/length of each box (crystal shard) will be determined by the amount of data it contains. I also see this group of 3D boxes joined together the same way French fries are held together in a box. I want to visualize that same look but without the box of course.
- Attachments
-
- Rough sketch/doodle idea
-
- Crystal shards forming off of the main body
-
- Group of French fries in a box
-
davidgordonartist
- Posts: 7
- Joined: Tue Jan 17, 2012 4:42 pm
Re: 3.08 3D Final Project Concept & Doodle
My final project will be an adaptation of my 2D spatial map project, which maps all SPL transactions by hour and Dewey category for a particular day. The idea is to improve the clarity of the graph by allowing the user to view the data points as 3D boxes, whose heights can be compared. I will also expand the project by including more days of data, allowing the user to change the day displayed.