Probability music: An exploration of probability in generative music
Probabilistic approach to art generation has been explored by art practitioners since the early twentieth century. Some notable early explorers of chance-based art are:
Lewis Carroll (Curiosa Mathematica, Part II: Pillow Problems),
http://mathlair.allfunandgames.ca/pillow.php
Marcel Duchamp (Erratum Musical, composition based on chance operations for three voices),
http://www.artesonoro.net/artesonoroglo ... champ.html
Tristan Tzara (chance operations as a method of generating poetry),
http://www.poets.org/poetsorg/text/poet ... operations
Ellsworth Kelly (Spectrum Colors Arranged by Chance I to VIII),
http://socks-studio.com/2014/03/05/the- ... i-to-viii/
François Morellet (Répartitions aléatoires, random distributions of black and white squares according to odd and even numbers of Pi)
http://slash-paris.com/en/artistes/fran ... t/a-propos
and John Cage (Music of Changes, Imaginary Landscape No. 4), among others.
http://en.wikipedia.org/wiki/Music_of_Changes
A probabilistic approach can be summarized as follows:
1. a space of possibilities is defined in explicit, mathematical terms
2. a probability distribution is defined over this space
3. an algorithm is executed which draws random samples from the space, in accordance with the probability distribution.
For my project, i will be experimenting with a dynamic tonal mapping strategy within a probabilistically defined space, driven by a physics simulator engine.
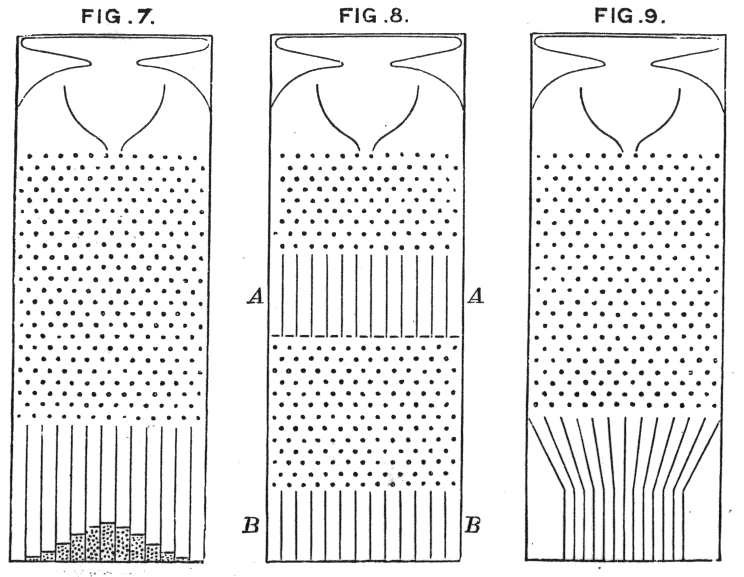
The bean machine (also known as the Quincunx or Galton box) is a device invented by Sir Francis Galton, an english victorian polymath to demonstrate the central limit theorem. The machine consists of a vertical board with interleaving rows of pins. A ball would be dropped from the top for it to traverse through the board, hitting a pin at every row on its way down, bouncing either to the left or right on each succession of rows.
http://upload.wikimedia.org/wikipedia/c ... iagram.png
Image01: Bean machine, as drawn by Sir Francis Galton
Each pin in a bean machine would have 8 neighboring pins (top, bottom, left, right, upper left, lower left, upper right, lower right), except for the pins at the edges of the interleaved grid. Since the pins in a bean machine are interleaved, a pin located at row ’x’ would have a top neighboring pin at row ’x+2’, bottom neighboring pin at row ‘x-2’, upper left and upper right neighboring pins at row ‘x+1’, lower left and lower right neighboring pins at row ’x-1’, and both left and right neighboring pins at row ’x’.
Image02: 8 neighboring pins
The harmonic table note layout is a symmetrical tonal array in a hexagonal grid, well known since at least the 18th century. This particular layout allows a large number of isomorphic note assignments, in which any given sequence or combination of musical intervals will have the same shape wherever it occurs. Since the layout is in a hexagonal grid, each cell have 6 adjacent neighbors. For each cell’s adjacent neighbors, it’s top neighbor will a perfect 5th apart, top right neighbor a major 3rd apart and it’s top left neighbor a minor 3rd apart. This mapping procedure leads to a half-step (semitone) interval distance at every other column. For example, a cell at {row x, column y} would have a cell a half-step higher at {row x, column y+2}, and a cell a half-step lower at {row x, column y-2}.
Image03: 8 neighboring cells
With 8 neighbors, a direct mapping of cells from the harmonic table note layout to the interleaved pins of a bean machine would be possible.
Imgae04: Mapping harmonic table cells to pins
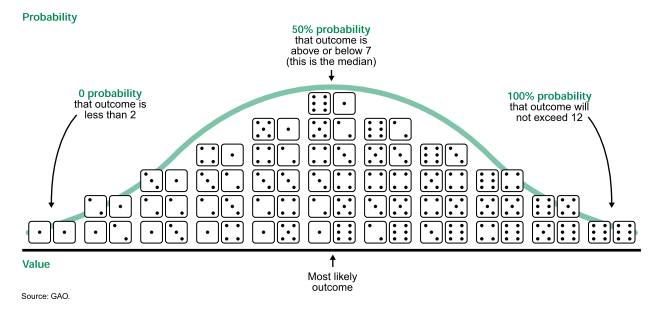
In an unbiased bean machine, the probability of a dropped ball bouncing to the left or right after hitting a pin are equally likely (50/50 chance). After a number of successive drops, the number of balls to exit the bean machine would form a bell curve, with the most probable exit point around the center and least probable exit point at the extreme right and left. A larger sample would yield a more distinct bell curve. As an example, the probability of getting any number from 1 to 6 in a roll of one unbiased 6 faced dice (cube) is 1/6, which means it is equally likely to get any of the six numbers. Increasing the number of dice rolled, for example to 2 dice rolled simultaneously, makes the lowest rollable number a 2, while the highest possible number a 12. Furthermore, there is only one possible combination of rolling a 2 (both dice rolled a 1) or 12 (both dice rolled a 6). However, in a 2 dice roll, there are 6 ways we could roll a 7 (6+1, 5+2, 4+3, 3+4, 2+5, 1+6), increasing the likelihood of rolling a 7 with a 2 dice roll. It is worth noting that 7 is the midrange, which is the mean of the lowest and highest possible values. (7 = (2+12) / 2)
http://4.bp.blogspot.com/_LnLmR0nJdMs/S ... O+Dice.png
Image05: Sum of 2 dice roll
As we increase the number of dice used per roll (increasing number of samples), the corresponding bell curve gets more distinct, with the most probable rolled value in the midrange, while the least probable values to the extreme left and right.
http://upload.wikimedia.org/wikipedia/c ... heorem.svg
Image06: Central Limit Theorem
For the bean machine, the probability that a ball would exit through the ‘k-th’ slot can be described with the following mathematical equation.
Image07: Equation
n and k in parentheses is the binomial coefficient, pronounced as ’n choose k’. The binomial coefficient describes the number of possible paths for a ball to reach the ‘k-th’ slot counting from the left, akin to the number of possible ways to roll a 7 with a 2 dice throw. In this instance, ’n’ corresponds to the number of rows available in the machine, while ‘k’ corresponds to the number of right bounces made by a ball on its way down all ’n’ rows. The formula p^k(1-p)^(n-k) can be broken to 2 parts. As ‘k’ corresponds to the number of right bounces, p^k describes the probability of a dropped ball bouncing to the right, while (1-p)^(n-k) describes the probability of the same ball bouncing to the left. In an unbiased bean machine, in which the probability of a ball going to either the left or right are equally likely, P is 0.5 (equates to 50% chance).
We can use Pascal’s triangle to help us to visualize the binomial coefficient for each pin in a bean machine. Pascal’s triangle is a mathematically defined triangular array, named after the French mathematician Blaise Pascal. To construct a Pascal’s triangle, start with a single element (an element is a pin for the bean machine) in the first row, numbered 1. The next row will have an extra element, and each element is a sum of its top left and top right neighbors (empty elements are substituted with a 0). The number for each element is the binomial coefficient for said location, which is the total number of possible routes a ball could take to reach a given pin in a bean machine.
http://upload.wikimedia.org/wikipedia/c ... ngle_5.svg
Image08: 6 rows of Pascal's triangle