How does the dead rock star stay alive?
:: Jing Yan
:: :: :: :: :: Here is the Revision (update 2016-1-30 ) :: :: :: :: :: :: :: :: :: ::
Data
I revised MySQL code to get more detail data. To be more specific, I split the data of books and CDs to each different titles.
NEU MySQL code
each CD's checkout times per month
Code: Select all
SELECT
    itemType,
    title,
    barcode,
    DATE_FORMAT(checkout, '20%y-%m') AS date,
    COUNT(checkout) AS checkoutTimes,
    AVG(TIMESTAMPDIFF(DAY, checkout, checkin)) AS itemDuration
FROM
    spl3._rawXmlDataCheckIns
WHERE
    bibNumber = '1952906'
        OR bibNumber = '2148651'
        OR bibNumber = '2023159'
        OR bibNumber = '2362135'
        OR bibNumber = '3029080'
        OR bibNumber = '2023157'
        OR bibNumber = '2299335'
        OR bibNumber = '1954184'
        OR bibNumber = '1736211'
        OR bibNumber = '2627462'
        OR bibNumber = '2128387'
        OR bibNumber = '3061214'
        OR bibNumber = '1959048'
        OR bibNumber = '1950899'
        OR bibNumber = '2444123'
        OR bibNumber = '2515298'
        OR bibNumber = '1976192'
        OR bibNumber = '2086964'
        OR bibNumber = '1953017'
        OR bibNumber = '2867039'
        OR bibNumber = '3057303'
        OR bibNumber = '1639110'
        OR bibNumber = '2363644'
        OR bibNumber = '2567243'
        OR bibNumber = '2211550'
        OR bibNumber = '3067034'
        OR bibNumber = '2631168'
        OR bibNumber = '1954182'
        OR bibNumber = '1880152'
        OR bibNumber = '2412531'
        OR bibNumber = '1976321'
        OR bibNumber = '2296937'
        OR bibNumber = '1972971'
        OR bibNumber = '2448150'
        OR bibNumber = '2612658'
        OR bibNumber = '1953009'
GROUP BY title,date
ORDER BY date,title
Code: Select all
SELECT
    itemType,
    title,
    barcode,
    DATE_FORMAT(checkout, '20%y-%m') AS date,
    COUNT(checkout) AS checkoutTimes,
	AVG(TIMESTAMPDIFF(DAY, checkout, checkin)) AS itemDuration

FROM
    spl3._rawXmlDataCheckIns
WHERE
    bibNumber = '1836438'
        OR bibNumber = '1965047'
        OR bibNumber = '2277690'
        OR bibNumber = '1823619'
        OR bibNumber = '2613601'
        OR bibNumber = '2707908'
        OR bibNumber = '2723037'
        OR bibNumber = '2815071'
        OR bibNumber = '2917442'
        OR bibNumber = '2941304'
        OR bibNumber = '3029321'
GROUP BY title,date
ORDER BY date,title

- " ALL ON " general layout

- CD data with normalization

- book data with normalization
I put the titles on the Y-axis. And the X-axis is still the timeline.
The Data of CD and book are distinguished by different color: blue for CD, and red for book. And they are all to some extent transparent to get an overlay view.
The checkout times per month is mapping to the length of the square
Interaction
The idea of ruler and footnote-data is kept. The ruler is updated to follow the mouse movement to be more useful. And footnote-data shows each value the mouse points at.

- first view

- title off

- label off
I like the way data pattern speaks for themselves, thus I spread them all over the screen. And make them the most obvious thing on the interface. To eliminate the distraction, I make switches which allows you to shut off the title and labels. It seems there are too much of them, I will change them to buttons next time.
Different color combination

- yellow and cyan
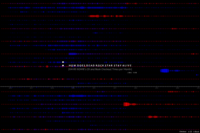
- red and blue

- red and light cyan
Style
In this revision, I explore more about Ryoji Ikeda’s art style. The background is changed from white to black to express a sense of empty both in time and space. The design is another attempt to create a feeling of calm, rationality and accuracy.
NEU Processing code
main tab
Code: Select all
/* Data Visualization - 2D Matrix (Processing 3)
 Based on Rodger's 2D Matrix Demo

 ::::::::::::::::::::::::::::::::::::::::::::::::::::::::::::::::::
 ::::::: How does Dead Rock Star Stay Alive :::::::::::::::::::::::
 ::::::::::::::::::::::::::::::::::::::::::::code: Jing Yan :::::::
 ::::::::::::::::::::theuniqueeye@gmail.com ::::::::::::::::::::::*/


// &&&&&&&&&&&&   HEY! here are all the switches   &&&&&&&&&&&&&&&&&&&
// C/c for CD; B/b for Book; T/t for title; N/n for normalization; L/l for label
// you press once to switch on and press again to switch off
// I am sorry there are a lot to remember.

// ::::::::::::::::::::::::::::::::::::::::::::::::::::::::::::::::::::

// Layout variables
float horizontalMargin = 10;
float verticalMargin = 20;

// 2D matrix table related variables
Table table0, table1, table2;
int numRows, numColumns;
int numBooks, numCDs;
float[][] dataMatrix;
String[] titlePool;
float maxValue, minValue;

// ### NOTE ### Because the checkout times for books are much smaller than the CDs.
// You can only get a general feeling of comparison by using maxValue of both CD and books.
// In order to exaimne more clearly the pattern for Books, I define this variable.
// It's used in normalization of Books' data. Press key N/n to have a try!
float maxValueBook;

// width and height for each cell
float cellWidth, cellHeight;

// position to draw the square
float positionX, positionY;

// some switches for interaction
boolean showCDs, showBooks, showTitle, showLabel;

// font for different text
PFont titleFont, labelFont1, labelFont2;

// ::::::::::::::::::::::::::::::::::::::::::::::::::::::::::::::::::::

void setup() {

  // setup the size of the window
  size(1080, 720);

  // Load checkout times for both CD and Book
  table0 = loadTable("DB_title.csv", "header");
  table1 = loadTable("CD_CoutMonth.csv", "header");
  table2 = loadTable("BK_CoutMonth.csv", "header");

  // load font
  titleFont = loadFont("Carlito-Bold-48.vlw");
  labelFont1 = loadFont("KohinoorDevanagari-Light-48.vlw");
  labelFont2 = loadFont("WaseemLight-48.vlw");

  // Row: each different item from book and CD
  // Column: every month from 2005/8 to 2015/1
  numColumns = 42;
  numRows = 114; // 5+9*12+1
  numBooks = 11;
  numCDs = 31;

  showCDs = false;
  showBooks = false;
  showTitle = true;
  showLabel = false;

  dataMatrix = new float[numRows][numColumns];
  titlePool = new String[numColumns];
  println("Rows: " + numRows + " Columns: " + numColumns);

  // ### NOTE ###  titlePool
  // store every title in titlePool
  for (int i=0; i<numColumns; i++) {
    titlePool[i] = table0.getString(i, 0);
  }

  // Select by title to pick out each related row
  // then get the month and cout values from that row

  for (int i=0; i<numColumns; i++) {
    for (TableRow row : table1.findRows(titlePool[i], 1)) {
      String date = row.getString(3);
      int year = Integer.parseInt(date.substring(0, 4));
      int month = Integer.parseInt(date.substring(5, 7));
      int j = (year-2006)*12 + month + 4;
      if (j<=numRows) dataMatrix[j][i] = row.getInt(4);
    }

    for (TableRow row : table2.findRows(titlePool[i], 1)) {
      String date = row.getString(3);
      int year = Integer.parseInt(date.substring(0, 4));
      int month = Integer.parseInt(date.substring(5, 7));
      int j = (year-2006)*12 + month + 4;
      if (j<=numRows) dataMatrix[j][i] = row.getInt(4);
    }
  }

  //turn the variable into month-format
  //same as the month-format in CD.csv data
  //String month= str(2005+(i+7)/12)+"/"+nf((i+8)%12, 2, 0);

  //### NOTE ### Try to keep the timeline evenly distribute. Not used yet.
  //if (row!=null) {
  // dataMatrix[i][j] = table1.getFloat(j,i+1) + table2.getFloat(j,i+1);
  //} else {
  // dataMatrix[i][j] = 0;
  //}

  maxValue = max2D(dataMatrix);
  minValue = min2D(dataMatrix);
  maxValueBook = maxValue;

  println("Max Value is " + maxValue);
  println("Min Value is " + minValue);
  pixelDensity(displayDensity());
}

// ::::::::::::::::::::::::::::::::::::::::::::::::::::::::::::::::::::

void draw() {

  //refresh the canvas every frame
  background(0);

  // draw 2D matrix for Books & CDs
  // show title and
  if (showCDs == true) showCDs();
  if (showBooks == true) showBooks();
  if (showTitle == true) showTitle();
  if (showLabel == true) showLabel();

  // draw Ruler examine the timeline
  drawRuler();
}
Code: Select all
// &&&&&&&&&&&&& For books &&&&&&&&&&&&&&&&&&&&&&
void showBooks() {
  for (int i=0; i<numRows; i++) {
    for (int j=0; j<numBooks; j++) {

      // cellWidth is a constant related to number of months
      cellWidth = (width-2*horizontalMargin)/(numRows-1);

      // cellHeight is related to the number of Books
      cellHeight = (height-2*verticalMargin)/(numBooks-1);

      // the size of each pixel-like-square is mapping to the checkout times
      float squareLength = map(dataMatrix[i][j], minValue, maxValueBook, 3, 20);

      // the (x,y) position of each pixel-like-square
      positionX = i * cellWidth + horizontalMargin;
      positionY = j * cellHeight + verticalMargin;

      // some layout settings
      noStroke();
      fill(220, 20, 60, 150); // red transparency 95%
      rectMode(CENTER);
      rect(positionX, positionY, squareLength, squareLength);


      // ### data showing for book-checkout-times ###

      boolean mouseXIn = mouseX<(positionX+cellWidth/2) && mouseX>(positionX-cellWidth/2);
      boolean mouseYIn = mouseY<(positionY+cellHeight/2) && mouseY>(positionY-cellHeight/2);

      if (mouseXIn && mouseYIn) {
        int mouseData = int(dataMatrix[i][j]);
        textAlign(RIGHT, TOP);
        textFont(labelFont2, 8);
        fill(255);
        text("Checkout", width-75, height-12);
        textFont(labelFont1, 10);
        text(mouseData+" Book", width-6, height-12);
      }
    }
  }
}
Code: Select all
// &&&&&&&&&&&&& For CDs &&&&&&&&&&&&&&&&&&&&&&
void showCDs() {
  for (int i=0; i<numRows; i++) {
    for (int j=numBooks; j<numColumns; j++) {

      // cellWidth is a constant related to number of months
      cellWidth = (width-2*horizontalMargin)/(numRows-1);

      // cellHeight is related to the number of CDs
      cellHeight = (height-2*verticalMargin)/(numCDs-1);

      // the size of each pixel-like-square is mapping to the checkout times
      float squareLength = map(dataMatrix[i][j], minValue, maxValue, 1, 20);

      // the (x,y) position of each pixel-like-square
      positionX = i * cellWidth + horizontalMargin;
      positionY = (j-numBooks) * cellHeight + verticalMargin;

      // some layout settings
      noStroke();
      fill(0, 245, 255, 150); // blue transparency 95%
      rectMode(CENTER);
      rect(positionX, positionY, squareLength, squareLength);


      // ### data showing for CD-checkout-times ###
      boolean mouseXIn = mouseX<(positionX+cellWidth/2) && mouseX>(positionX-cellWidth/2);
      boolean mouseYIn = mouseY<(positionY+cellHeight/2) && mouseY>(positionY-cellHeight/2);

      if (mouseXIn && mouseYIn) {
        int mouseData = int(dataMatrix[i][j]);
        textAlign(RIGHT, TOP);
        textFont(labelFont2, 8);
        fill(255);
        text("Checkout", width-75, height-12);
        textFont(labelFont1, 10);
        text(mouseData+" CD", width-45, height-12);
      }
    }
  }
}
Code: Select all
// &&&&&&&&&&&&   here are all the switches   &&&&&&&&&&&&&&&&&&&
// C/c for CD; B/b for Book; T/t for title; N/n for normalization
// you press once to switch on and press again to switch off

void keyPressed() {

  // press key for showing and hidding
  if (key == 'C'|| key =='c')
    showCDs = !showCDs;
  if (key == 'B'|| key =='b')
    showBooks = !showBooks;
  if (key =='T'|| key =='t')
    showTitle = !showTitle;
  if (key =='L'|| key =='l')
    showLabel = !showLabel;

  // press key for normalization of Book patterns
  if (key =='N'|| key=='n') {
    if (maxValueBook == maxValue)
      maxValueBook = 17;
    else maxValueBook = maxValue;
  }
}
:: :: :: :: :: Here is the Original Version ( 2016-1-24 ) :: :: :: :: :: :: :: :: :: ::
Concept
In project 1, I think the “aliveness” of David Bowie can be examined through two dimension: the quantity and quality. While the checkout times could be regarded as the quantity index, the checkout duration could be considered as the quality index.
In project 2, I mainly
focus on the quantity dimension. I select the
data of David Bowie’s CDs’ and related books’ checkout times per month from 2005 to 2015 in the Seattle Public Library.
Here is the Query code.
David Bowie’s CDs checkout times by year/month/day
Code: Select all
SELECT
    DATE_FORMAT(checkout, '20%y-%m-%d') AS formatted_date,
    COUNT(checkout) AS checkoutTimes
FROM
    spl3._rawXmlDataCheckIns
WHERE
    bibNumber = '1952906'
        OR bibNumber = '2148651'
        OR bibNumber = '2023159'
        OR bibNumber = '2362135'
        OR bibNumber = '3029080'
        OR bibNumber = '2023157'
        OR bibNumber = '2299335'
        OR bibNumber = '1954184'
        OR bibNumber = '1736211'
        OR bibNumber = '2627462'
        OR bibNumber = '2128387'
        OR bibNumber = '3061214'
        OR bibNumber = '1959048'
        OR bibNumber = '1950899'
        OR bibNumber = '2444123'
        OR bibNumber = '2515298'
        OR bibNumber = '1976192'
        OR bibNumber = '2086964'
        OR bibNumber = '1953017'
        OR bibNumber = '2867039'
        OR bibNumber = '3057303'
        OR bibNumber = '1639110'
        OR bibNumber = '2363644'
        OR bibNumber = '2567243'
        OR bibNumber = '2211550'
        OR bibNumber = '3067034'
        OR bibNumber = '2631168'
        OR bibNumber = '1954182'
        OR bibNumber = '1880152'
        OR bibNumber = '2412531'
        OR bibNumber = '1976321'
        OR bibNumber = '2296937'
        OR bibNumber = '1972971'
        OR bibNumber = '2448150'
        OR bibNumber = '2612658'
        OR bibNumber = '1953009'
GROUP BY formatted_date
Code: Select all
SELECT
    DATE_FORMAT(checkout, '20%y-%m-%d') AS formatted_date,
    COUNT(checkout) AS checkoutTimes
FROM
    spl3._rawXmlDataCheckIns
WHERE
    bibNumber = '1836438'
        OR bibNumber = '1965047'
        OR bibNumber = '2277690'
        OR bibNumber = '1823619'
        OR bibNumber = '2613601'
        OR bibNumber = '2707908'
        OR bibNumber = '2723037'
        OR bibNumber = '2815071'
        OR bibNumber = '2917442'
        OR bibNumber = '2941304'
        OR bibNumber = '3029321'
GROUP BY formatted_date
- sketch - layout
- sketch - theme and inspiration
General layout
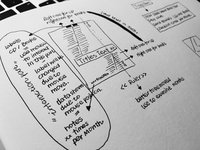
I create a
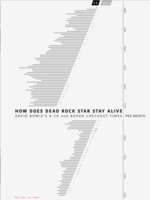
2-column matrix to compare the CD and books. There are 114 rows which show every month from 2005/08 to 2015/01. The
width of each cell-bar is
mapped to the
checkout times.
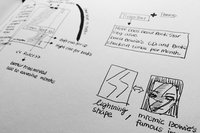
Inspired by David Bowie’s famous image of
Ziggy Stardust, I would like to shape the layout of the visualization somehow related. Thus I break the matrix into
lightning shape.
Interaction
I try to create a general view of the idea at first glance. And by interaction with key “C/c”,
the color scheme and normalization will be applied which allow audience to examine the detailed relationship between data much easier. By press the key “R/r”,
a ruler of timeline will show up for positioning time. Moreover, by moving the mouse, related
label will get dark on the top of the screen and
precise data number will show up at the left bottom of the screen.
2D-Matrix
with ruler
- screenshoot - without color scheme and normalization
with color scheme and normalization
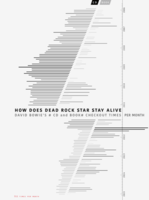
- screenshoot - with mouse interaction in CD area
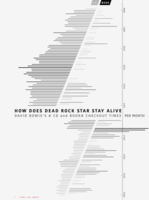
- screenshoot- with mouse interaction in Book area
Here is the Processing code.
main tab
Code: Select all
/* Data Visualization - 2D Matrix (Processing 3)
 Based on Rodger's 2D Matrix Demo

::::::::::::::::::::::::::::::::::::::::::::::::::::::::::::::::::
::::::: How does Dead Rock Star Stay Alive :::::::::::::::::::::::
::::::::::::::::::::::::::::::::::::::::::::code: Jing Yan :::::::
::::::::::::::::::::theuniqueeye@gmail.com ::::::::::::::::::::::*/

// :: Interaction KEY
// :: press R / r to show a ruler
// :: press C / c to apply the color scheme and do normalization

// Layout variables
float constantVerticalMargin = 15;

// 2D matrix table related variables
Table table1, table2;
int numRows, numColumns;
float[][] dataMatrix;
float maxValue, minValue, maxBookValue;

// width and height for each cell and title
float cellWidth1, cellWidth2, cellHeight;
float TitleWidth, TitleHeight;

boolean colorApplied = false;
boolean normalization = false;
boolean drawRuler = false;

// font for each text
PFont titleFont, subtitleFont, labelFont, noteFont;
PImage titleImage, labelImage1, labelImage2;


// Mouse data
boolean cdOrBook;
int mouseData;

// ::::::::::::::::::::::::::::::::::::::::::::::::::::::::::::::::::::

void setup() {
  // create a vertical interface
  size(560, 960);

  // Make the screen resizable.
  surface.setResizable(true);

  // Load checkout times for both CD and Book
  table1 = loadTable("CD_CheckoutByMonth.csv", "header");
  table2 = loadTable("BK_CheckoutByMonth.csv", "header");

  titleFont = loadFont("KohinoorDevanagari-Bold-13.vlw");
  subtitleFont = loadFont("KohinoorDevanagari-Medium-10.vlw");
  labelFont = loadFont("OratorStd-8.vlw");
  noteFont = loadFont("KohinoorDevanagari-Demi-7.vlw");

  titleImage = loadImage("title-04.png");
  labelImage1 = loadImage("label-05.png");
  labelImage2 = loadImage("label-06.png");

  cdOrBook = false;

  // Row: 2 types for book and CD
  // Column: every month from 2005/8 to 2015/1
  numColumns = 2;
  numRows = 114; // 5+9*12+1

  dataMatrix = new float[numRows][numColumns];
  println("Rows: " + numRows + " Columns: " + numColumns);

  // The following for loop is used to load data into dataMatrix.
  // It's important to keep the timeline evenly distribute.

  for (int i=0; i<numRows; i++) {

    // turn the variable into month-format
    // same as the month-format in CD.csv data
    String month= str(2000+(i+8)/12+5)+"-"+nf((i+8)%12+1, 2, 0);

    // load CD's data into the 1st column
    TableRow row = table1.findRow(month, 0);
    if (row!=null) {
      dataMatrix[i][0] = row.getInt(1);
    } else {
      dataMatrix[i][0] = 0;
    }

    // turn the variable into month-format
    // same as the month-format in Book.csv data
    month= str(2000+(i+8)/12+5)+"/"+nf((i+8)%12+1, 2, 0);

    // load book's data into the 2rd column
    row = table2.findRow(month, 0);
    if (row!=null) {
      dataMatrix[i][1] = row.getInt(1);
    } else {
      dataMatrix[i][1] = 0;
    }
  }

  // get the maxValue, minValue
  maxValue = max2D(dataMatrix);
  minValue = min2D(dataMatrix);
  println("Max Value is " + maxValue);
  println("Min Value is " + minValue);

  pixelDensity(displayDensity());
  smooth();
  noStroke();
}

// ::::::::::::::::::::::::::::::::::::::::::::::::::::::::::::::::::::

void draw() {
  //noStroke();
  background(245);
  TitleWidth = 150;
  TitleHeight = 50;

  // the height of each cell is the same
  cellHeight = (height - constantVerticalMargin*2 - TitleHeight)/(numRows);

  // Draw 2D Matrix!!
  noStroke();
  rectMode(CORNER);

  // Break the 2D matrix into 2 parts
  // 1st part
  for (int i=0; i<65; i++) {

    // the width of each cell is related to the data value
    cellWidth1 = map(dataMatrix[i][0], minValue, maxValue, 0, 200);
    cellWidth2 = map(dataMatrix[i][1], minValue, maxValue, 0, 200);

    // draw cells along the hypotenuse of "lightening"
    float x = (2-float(i)/76)*width/3;
    float y = constantVerticalMargin + cellHeight * i;
    float gap = 5;

    fill(128);

    rect(x-cellWidth1-gap, y, cellWidth1, 0.3*cellHeight);
    rect(x+gap, y, cellWidth2, 0.3*cellHeight);

    // interaction with mouse position
    // when the mouse falls in the range of each data,
    // show the number of the data on left down corner of screen
    // when the mouse falls in the CD or book part of data, darken the label respectively

    boolean isMouseXIn = mouseX < (x-cellWidth1-gap+cellWidth1);
    boolean isMouseYIn = mouseY > y && mouseY < y + 0.3*cellHeight;
    if (isMouseXIn && isMouseYIn) {
      mouseData = int(dataMatrix[i][0]);
      cdOrBook = false;
    }

    isMouseXIn = mouseX > x+gap ;
    isMouseYIn = mouseY > y && mouseY < y + 0.3*cellHeight;
    if (isMouseXIn && isMouseYIn) {
      mouseData = int(dataMatrix[i][1]);
      cdOrBook = true;
    }
  }

  // 2nd part
  for (int i=65; i<114; i++) {

    cellWidth1 = map(dataMatrix[i][0], minValue, maxValue, 0, 200);
    cellWidth2 = map(dataMatrix[i][1], minValue, maxValue, 0, 200);

    float x = (2-float(i)/76)*width/3 + TitleWidth;
    float y = constantVerticalMargin + cellHeight * i+TitleHeight;
    float gap = 5;

    fill(128);

    rect(x-cellWidth1-gap, y, cellWidth1, 0.3*cellHeight);
    rect(x+gap, y, cellWidth2, 0.3*cellHeight);

    // interaction with mouse position
    // when the mouse falls in the range of each data,
    // show the number of the data on left down corner of screen
    // when the mouse falls in the CD or book part of data, darken the label respectively

    boolean isMouseXIn = mouseX < (x-cellWidth1-gap+cellWidth1);
    boolean isMouseYIn = mouseY > y && mouseY < y + 0.3*cellHeight;
    if (isMouseXIn && isMouseYIn) {
      mouseData = int(dataMatrix[i][0]);
      cdOrBook = false;
    }

    isMouseXIn = mouseX > x+gap;
    isMouseYIn = mouseY > y && mouseY < y + 0.3*cellHeight;
    if (isMouseXIn && isMouseYIn) {
      mouseData = int(dataMatrix[i][1]);
      cdOrBook = true;
    }
  }

  // apply color and normalization
  if (colorApplied == true) colorScheme();

  // draw a timeline
  if (drawRuler == true) drawRuler();

  // draw title and labels and note
  drawText();
}

// ::::::::::::::::::::::::::::::::::::::::::::::::::::::::::::::::::::
Code: Select all
// Let's apply grey color to the 2D matrix
// and meanwhile normalize it.

void colorScheme() {

  // use maxBookValue to minimize the scale difference between books and CDs.
  maxBookValue = 21;

  // Draw 2D Matrix with color and normalization
  for (int i=0; i<65; i++) {

    // the width of each cell is related to the data value
    cellWidth1 = map(dataMatrix[i][0], minValue, maxValue, 0, 200);
    cellWidth2 = map(dataMatrix[i][1], minValue, maxBookValue, 0, 200);

    float x = (2-float(i)/76)*width/3;
    float y = constantVerticalMargin + cellHeight * i;
    float gap = 5;

    // apply color with mapping
    fill(map(cellWidth1, 0, 200, 255, 0));
    rect(x-cellWidth1-gap, y, cellWidth1, 0.3*cellHeight);

    fill(map(cellWidth2, 0, 200, 255, 0));
    rect(x+gap, y, cellWidth2, 0.3*cellHeight);

  }
  for (int i=65; i<114; i++) {

    // the width of each cell is related to the data value
    cellWidth1 = map(dataMatrix[i][0], minValue, maxValue, 0, 200);
    cellWidth2 = map(dataMatrix[i][1], minValue, maxBookValue, 0, 200);

    float x = (2-float(i)/76)*width/3 + TitleWidth;
    float y = constantVerticalMargin + cellHeight * i+TitleHeight;
    float gap = 5;

    // apply color with mapping
    fill(map(cellWidth1, 0, 200, 255, 0));
    rect(x-cellWidth1-gap, y, cellWidth1, 0.3*cellHeight);

    fill(map(cellWidth2, 0, 200, 255, 0));
    rect(x+gap, y, cellWidth2, 0.3*cellHeight);
  }
}
Code: Select all
// Let's draw a ruler!
// This part is used to draw a timeline
// start from 2005-08 end at 2015-01

void drawRuler() {
  stroke(0);
  strokeWeight(0.4);
  fill(0);

  // draw a long vertical line
  line(460, 0, 460, height);

  for (int i = 0; i<65; i++) {
      float y = constantVerticalMargin + cellHeight * i;

    // draw a longer horizontal line for each year
    if ((i+8)%12 == 0 ) {
      line(453, y, 460, y);

      // add year(label) to longer lines
      textAlign(CENTER, TOP);
      textFont(labelFont, 8);
      pushMatrix();
      translate(465, y);
      rotate(- PI/2.0);
      textSize(8);
      text(str(2000+(i+8)/12+5), 0, 0);
      popMatrix();

      // draw short horizontal lines for each month
    } else line(457, y, 460, y);
  }

  // the title seperate the ruler into 2 parts
  for (int i = 65; i<114; i++) {
    float y = constantVerticalMargin + cellHeight * i + TitleHeight;
    if ((i+8)%12 == 0 ) {
      // draw year lines
      line(453, y, 460, y);

      // year label
      textAlign(CENTER, TOP);
      textFont(labelFont, 8);
      pushMatrix();
      translate(465, y);
      rotate(- PI/2.0);
      text(str(2000+(i+8)/12+5), 0, 0);
      popMatrix();

      // draw month lines
    } else  line(457, y, 460, y);
  }

  // The stroke is pretty wired, it just cannot turn down.
  noStroke();
}
Code: Select all
// Let's draw TITLE, labels and notes.

void drawText() {
  textAlign(RIGHT, TOP);
  //textFont(titleFont, 20);
  //text("HOW DOES DEAD ROCK STAR STAY ALIVE", 457, constantVerticalMargin + cellHeight * 65+4);
  image(titleImage, 0, constantVerticalMargin + cellHeight * 65+4);
  if (cdOrBook == false) image(labelImage1, 0, 0);
  else image(labelImage2, 0, 0);

  textFont(labelFont, 8);
  //text("CD", 375, 10);
  //text("Book", 385, 10);

  fill(215,26,33);
  textAlign(LEFT, BOTTOM);
  text(str(mouseData), 53, height-constantVerticalMargin);
  textAlign(RIGHT, BOTTOM);
  text(" times per month", 147, height-constantVerticalMargin);
}
I really appreciate the style of
Ryoji Ikeda’s visualization art work. And as the theme is about death and aliveness, I try to create a feeling of
calm, rationality, accuracy and make the scene somehow like an
electrocardiogram.
About the color scheme, there should be some development in the future.As David Bowie is famous for his constantly changing images and also known as pioneer of visual rock, I am thinking of
picking colors from his
CD covers to use as color scheme.